Who is this for? This is intended for sellers or individuals responsible for analyzing sales performance on Seller Central. It provides step-by-step instructions on how to generate and download Sales Dashboard Reports
Objective: The objective of this SOP is to guide users in accessing and utilizing the Sales Dashboard feature within Business Reports on Seller Central. By following these instructions, users will be able to retrieve up-to-date sales statistics, compare sales data over different periods, and customize their reports to gain valuable insights into their business performance.
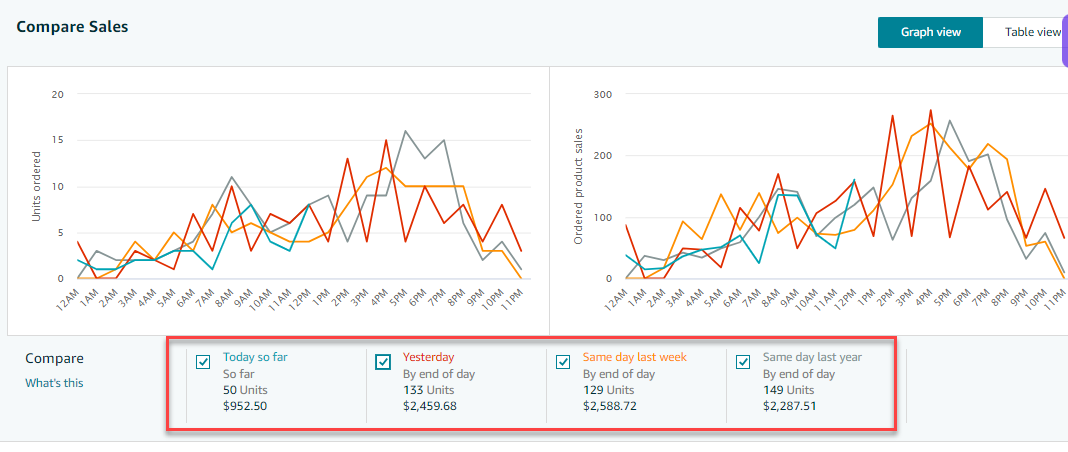
The Sales Dashboard on Seller Central provides sellers with a comprehensive overview of their sales performance, allowing them to monitor key metrics, analyze trends, and make data-driven decisions. This feature includes various tools and interactive elements that enable users to filter and compare sales data based on different parameters.
To generate a Sales Dashboard Report, follow these steps:
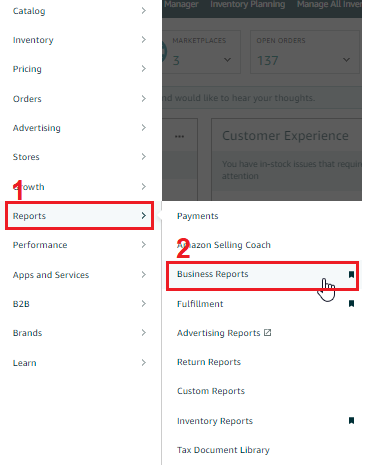
- Go to Seller Central and click on the "Reports" tab in the top menu and select "Business Reports" from the drop-down menu.
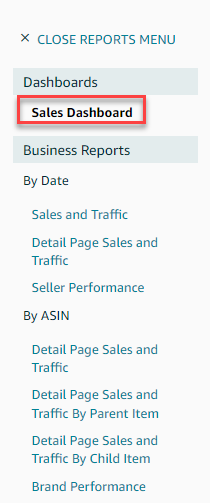
- On the next page, click on the "Sales Dashboard" link located in the left-side menu.
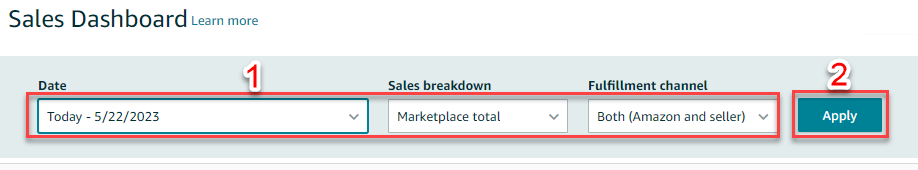
- Choose the date or dates, sales breakdown, and fulfillment channel you want to include in your report using the available drop-down menus above the displayed graphs. Click the "Apply" button after making your selections.
- Customize your report by selecting or deselecting the comparative views using the options below the graphs.
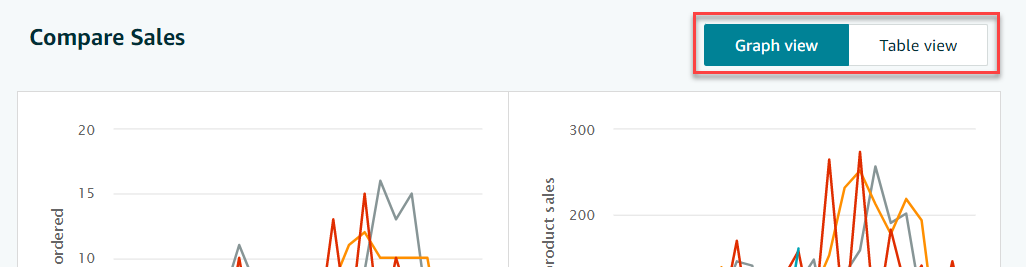
- To switch between "Graph View" and "Table View", click the appropriate button located in the top left corner of the graphs or table.
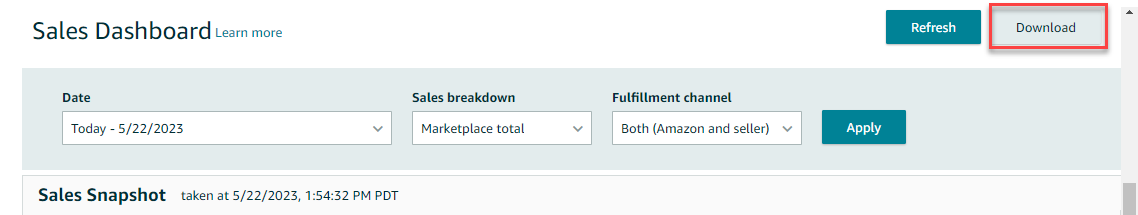
- Once you have created the report data you want to see, click the "Download" button in the top right corner of the page to download your report.