Who is this for : This is intended for individuals who manage a business on the Amazon platform and need to analyze their performance metrics.
Objective: To provide a step-by-step guide on how to generate, customize, and download a Seller Performance Report from Seller Central.
The Seller Performance Report is a valuable tool for sellers on Seller Central, as it provides comprehensive insights into their business performance. This report includes crucial data such as sales metrics, order information, and customer feedback.
To generate the Seller Performance Report, you will need to access the "Reports" tab in Seller Central. This SOP will guide you through the process of customizing the report, including selecting desired columns, adjusting date ranges, and viewing data by day, week, or month. Finally, it will demonstrate how to download the report in CSV format for further analysis.
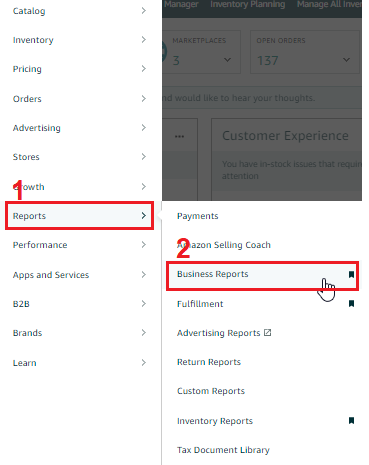
To generate a Seller Performance Report, go to the "Reports" tab on the top menu of Seller Central and select "Business Reports" from the Drop-Down Menu.
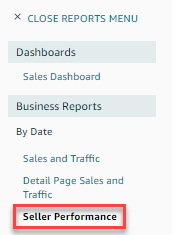
On the following page, navigate to the left side menu and click on "Seller Performance" under the sub-heading "By Date."
Click on the small grey "SHOW/HIDE COLUMNS" button on the right side of the page to open the available Columns Fields and select or deselect the columns and information you want to include in your report.
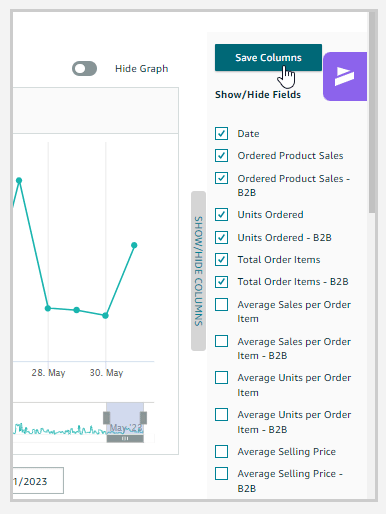
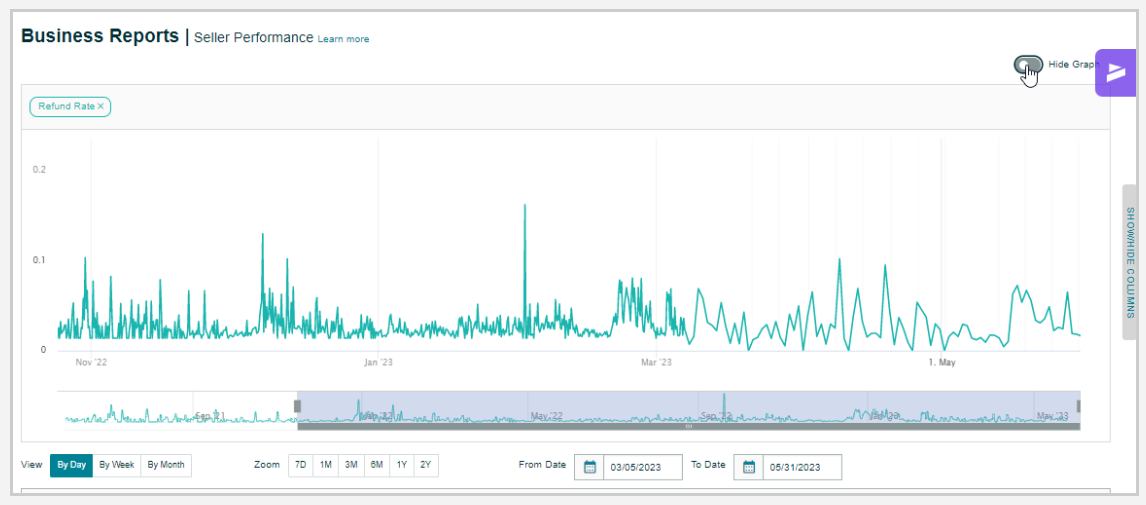
Enable or disable the graph display by clicking the "Show Graph" or "Hide Graph" button located in the top right corner of the table.
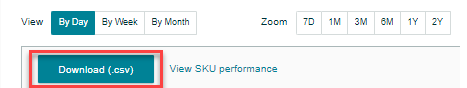
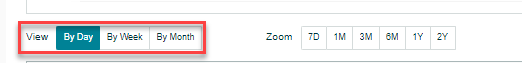
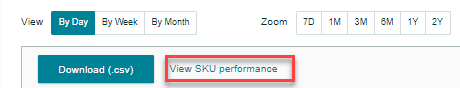
Choose to view by Day, Week, or Month by clicking the relevant buttons below the graph or above the table.
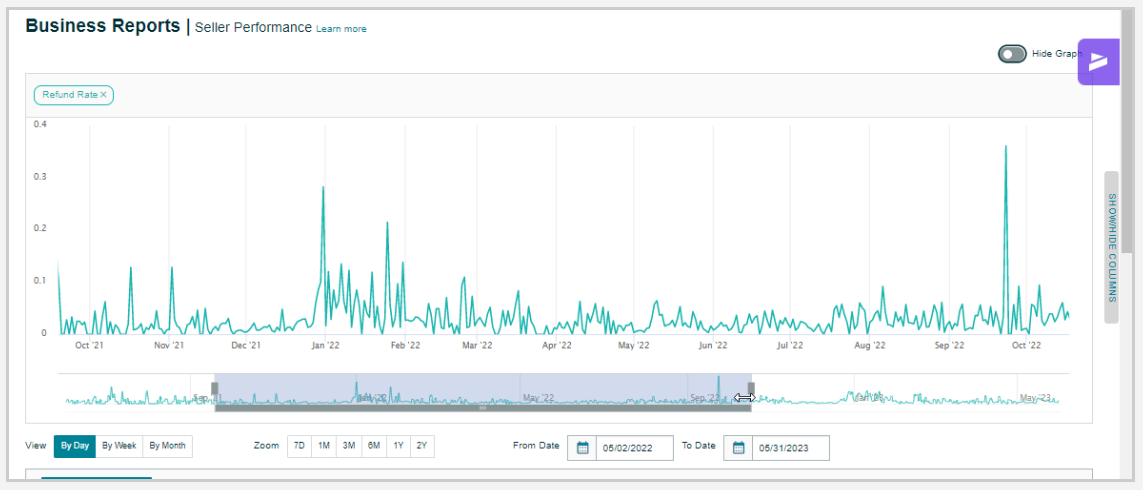
Customize the dates by dragging the scroll bar back and forth from the left side of the page beneath the graph or above the table.
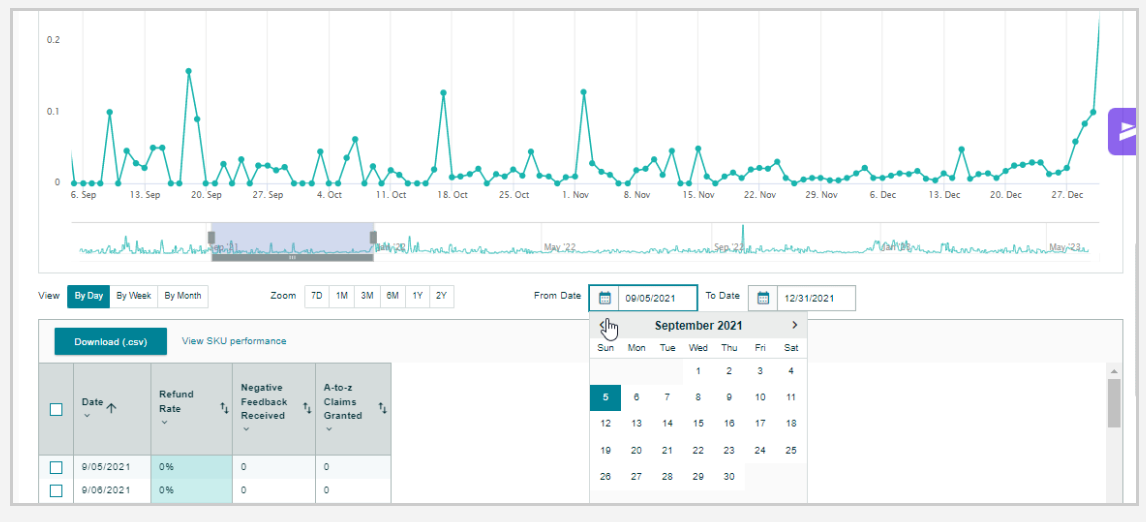
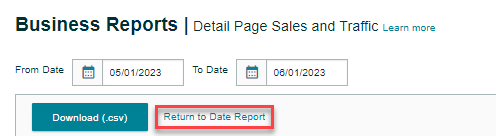
Alternatively, customize the dates by clicking the calendar icons for the "From" date and "To" date respectively beneath the graph and above the table on the right side of the page, and selecting your desired date range or period.
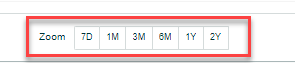
Zoom into a section of the graph by clicking the 7D (7 days), 1M (1 month), 3M (3 months), 6M (6 months), 1Y (1 year), or 2Y (2 years) button beneath the graph towards the left side of the page.
Select the "SKU Performance" option to view the report as a table by SKU instead of by date. This will remove the graph and give you a report by SKU.
Return to the standard date-dependent report by clicking the "Return to Date Report" button that will appear after you have selected the "SKU Performance" report option.
Once you are satisfied with the changes made to your report, download it by clicking the "Download" button on the right side of the page above the table, and selecting the "CSV" option from the Drop-Down Menu.